Dealing with Errors
Every now and then you’ll make some mistake in your code which is going to result in an evaluation error. Clojure’s errors are notorious for their complexity and CIDER takes a lot of effort to make it easier to decipher those.
Most of the time CIDER will display the errors in a dedicated buffer alongside the buffer you’re currently evaluating code in.
| Use q to quickly close an error buffer. |
Configuration
By default, when an exception occurs, CIDER will display the exception
in an error buffer using cider-stacktrace-mode. You can suppress
this behavior, which causes just the error message to be output as a
temporary overlay or in the echo area:
(setq cider-show-error-buffer nil)
you will only see the overlay if cider-use-overlays is non-nil.
|
Starting from CIDER 1.8.0, only runtime exceptions (and not compilation errors)
will cause a stacktrace buffer to be shown. This better follows Clojure 1.10’s
intended semantics.
This behavior is controlled by the cider-clojure-compilation-error-phases configuration option.
If you wish for the error phase to be ignored, and to only take cider-show-error-buffer into account,
please customize:
(setq cider-clojure-compilation-error-phases nil)At times, the error being displayed will originate from a bug in CIDER
itself. These internal errors might frequently occur and interrupt
your workflow, but you might not want to suppress all stacktrace
buffers by using cider-show-error-buffer. Instead, you might only
want to suppress this specific type of internal error. The
stacktrace buffers provide such an option when displaying an internal
error. A toggle button will be displayed with the error type’s name,
and you can toggle whether this particular type of error will cause
the stacktrace buffer to automatically show itself. The toggle button
controls this behavior only during the current Emacs session, but if
you would like to make the suppression more permanent, you can do so
by customizing the cider-stacktrace-suppressed-errors variable. The
buffer will also provide a direct link to the bug reporting page to
help facilitate its diagnosis and repair.
Independently of the value of cider-show-error-buffer or
cider-stacktrace-suppressed-errors, CIDER always generates the error
buffer in the background. You can use cider-selector (C-c M-s) to
visit this buffer if you decide that you need to.
There are two more selective strategies for the error buffer:
(setq cider-show-error-buffer 'except-in-repl) ; or
(setq cider-show-error-buffer 'only-in-repl)
To disable auto-selection of the error buffer when it’s displayed:
(setq cider-auto-select-error-buffer nil)By default, when you jump to the source of a given stack frame,
an Emacs window other than that of *cider-error* will be chosen.
If you wish to reuse `*cider-error*’s window instead, please configure:
(setq cider-stacktrace-navigate-to-other-window nil)
If you have customized this setting, when you have navigated to a given source file,
you can navigate back to *cider-error* with C-x <left> (previous-buffer) or M-, (xref-pop-marker-stack).
|
Navigating Stacktraces
CIDER comes with a powerful solution for dealing with Clojure
stacktraces. CIDER presents stack traces in a special major mode,
cider-stacktrace-mode, which gives you gives you some key features:
-
the ability to filter out certain stack frames to reduce clutter
-
some handy ways to navigate to the cause of the exception
-
the ability to jump straight to code with a single keystroke
Keybindings
| Command | Keyboard shortcut | Description |
|---|---|---|
|
M-p |
Move point to previous cause |
|
M-n |
Move point to next cause |
|
M-. or Return |
Navigate to the source location (if available) for the stacktrace frame |
|
Tab |
Cycle current cause detail |
|
0 or S-Tab |
Cycle all cause detail |
|
1 |
Cycle cause #1 detail |
|
2 |
Cycle cause #2 detail |
|
3 |
Cycle cause #3 detail |
|
4 |
Cycle cause #4 detail |
|
5 |
Cycle cause #5 detail |
|
j |
Toggle display of Java frames |
|
c |
Toggle display of Clojure frames |
|
r |
Toggle display of REPL frames |
|
t |
Toggle display of tooling frames (e.g. compiler, nREPL middleware) |
|
d |
Toggle display of duplicate frames |
|
p |
Toggle display only project frames |
|
a |
Toggle display of all frames |
Filtering Stack Frames
CIDER helps you cut through the clutter of Clojure stacktraces by
allowing you to apply a list of filters using the
cider-stacktrace-default-filters variable. Valid filter types
include java, clj, repl, tooling, and dup. Specifying one of
these filters will remove the corresponding frames from the stacktrace
display. There are also "positive" filtering types (reverse filters)
that specify what should be shown. The value of project, for
instance, will cause only project frames to be shown, and all will
force all stackframes to be shown. Note that project and all are
mutually exclusive. Whichever one is first will determine the behavior
if they are both present.
(setq cider-stacktrace-default-filters '(tooling dup))
;; or
(setq cider-stacktrace-default-filters '(project))
Wrapping Error Messages
Finally, CIDER can wrap error messages when they are displayed in a
buffer to help improve their readability. CIDER uses
cider-stacktrace-fill-column for this, which can take on three
types of values:
-
nil: The error is not wrapped. -
numeric: The error message is wrapped to the specified fill column.
-
Something truthy but non-numeric: The error message is wrapped using the value of
fill-column.
The following will cause error messages to be wrapped to 80 columns, for instance:
(setq cider-stacktrace-fill-column 80)Inspector integration
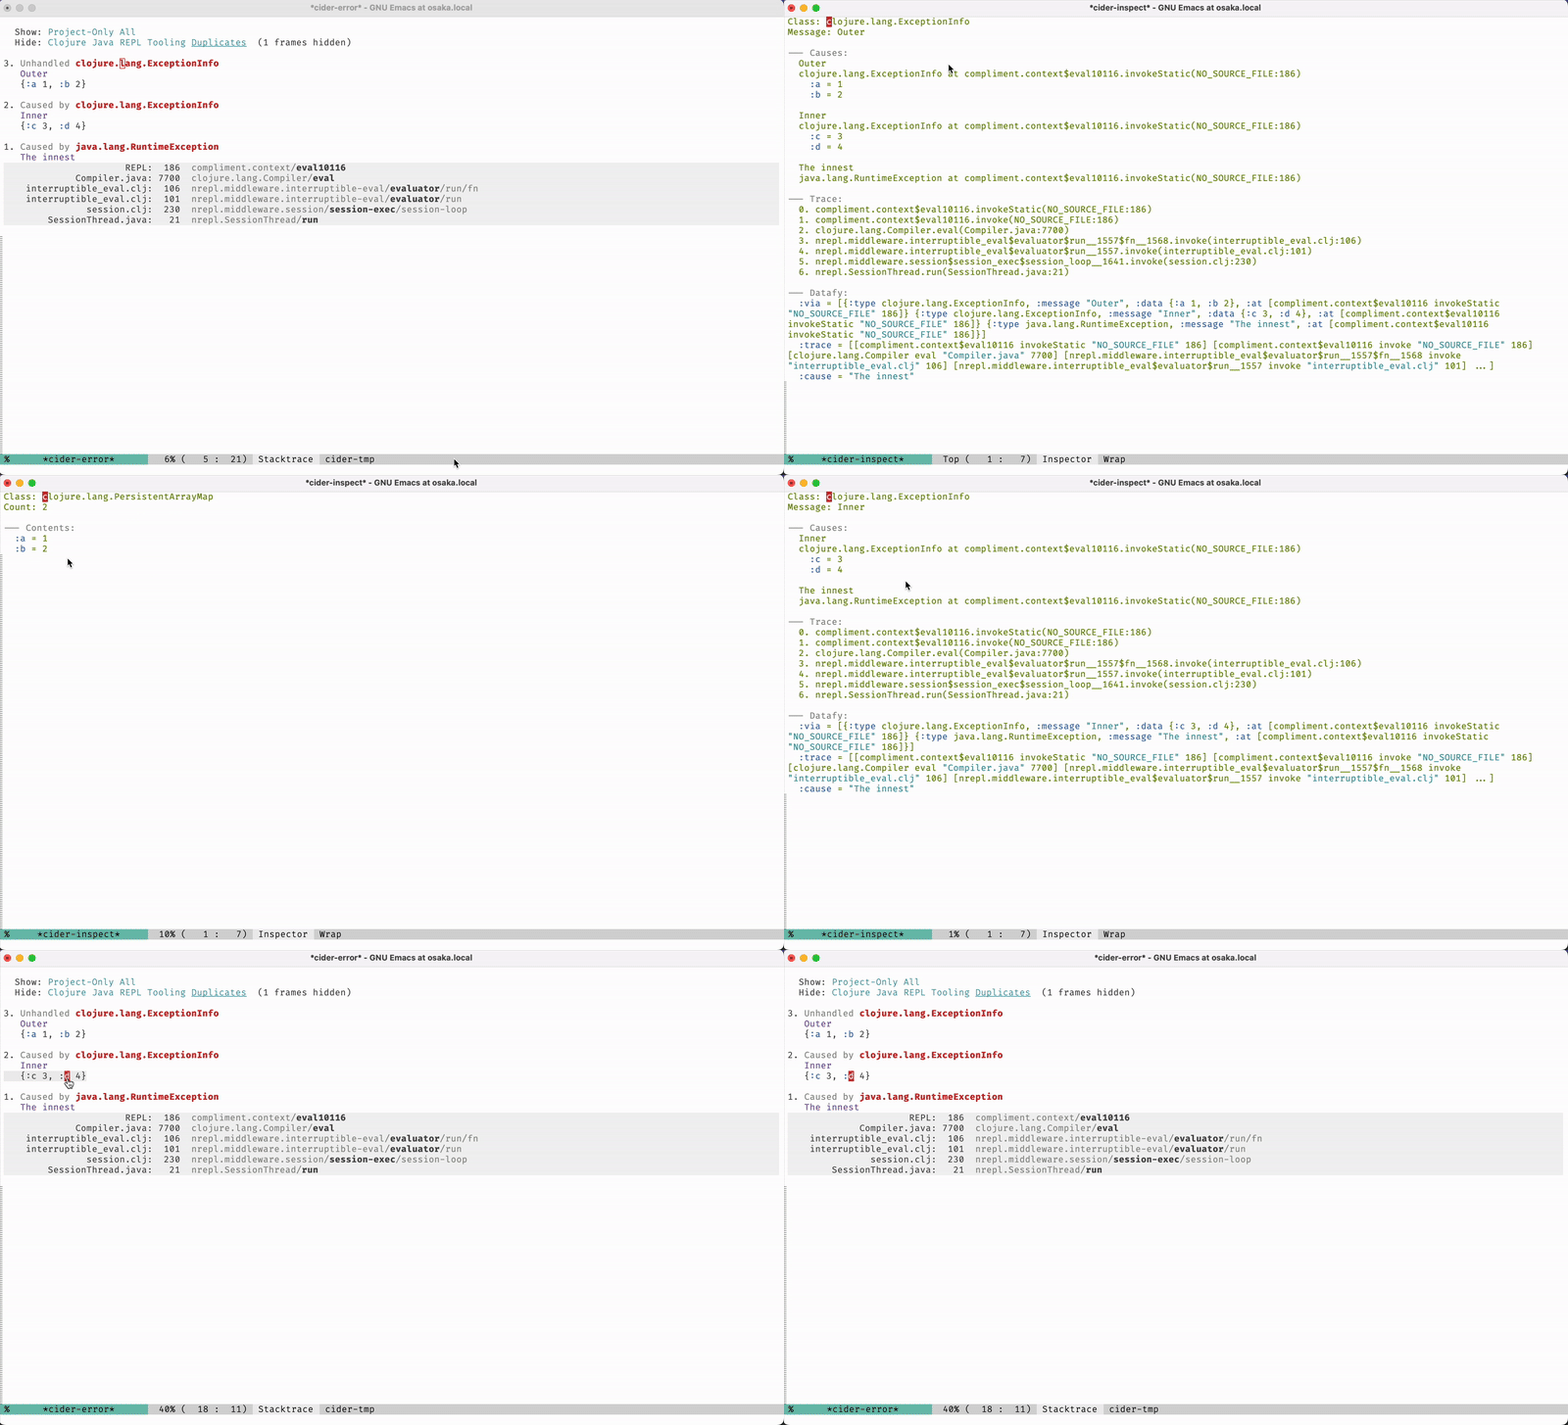
Within cider-error, when clicking directly a top-level exception (any of
them in the cause chain), that specific exception will be inspected with the
CIDER Inspector. You can also click on the
rendered exception data to inspect it directly.
This clicking is defined and customizable in cider-stacktrace-exception-map
and cider-stacktrace-ex-data-map.
