Tracing Function Execution
You can trace the arguments supplied to, and the result values produced by functions using C-c M-t v. CIDER will prompt you for the name of the function you want to trace, defaulting to the previous top-level definition.
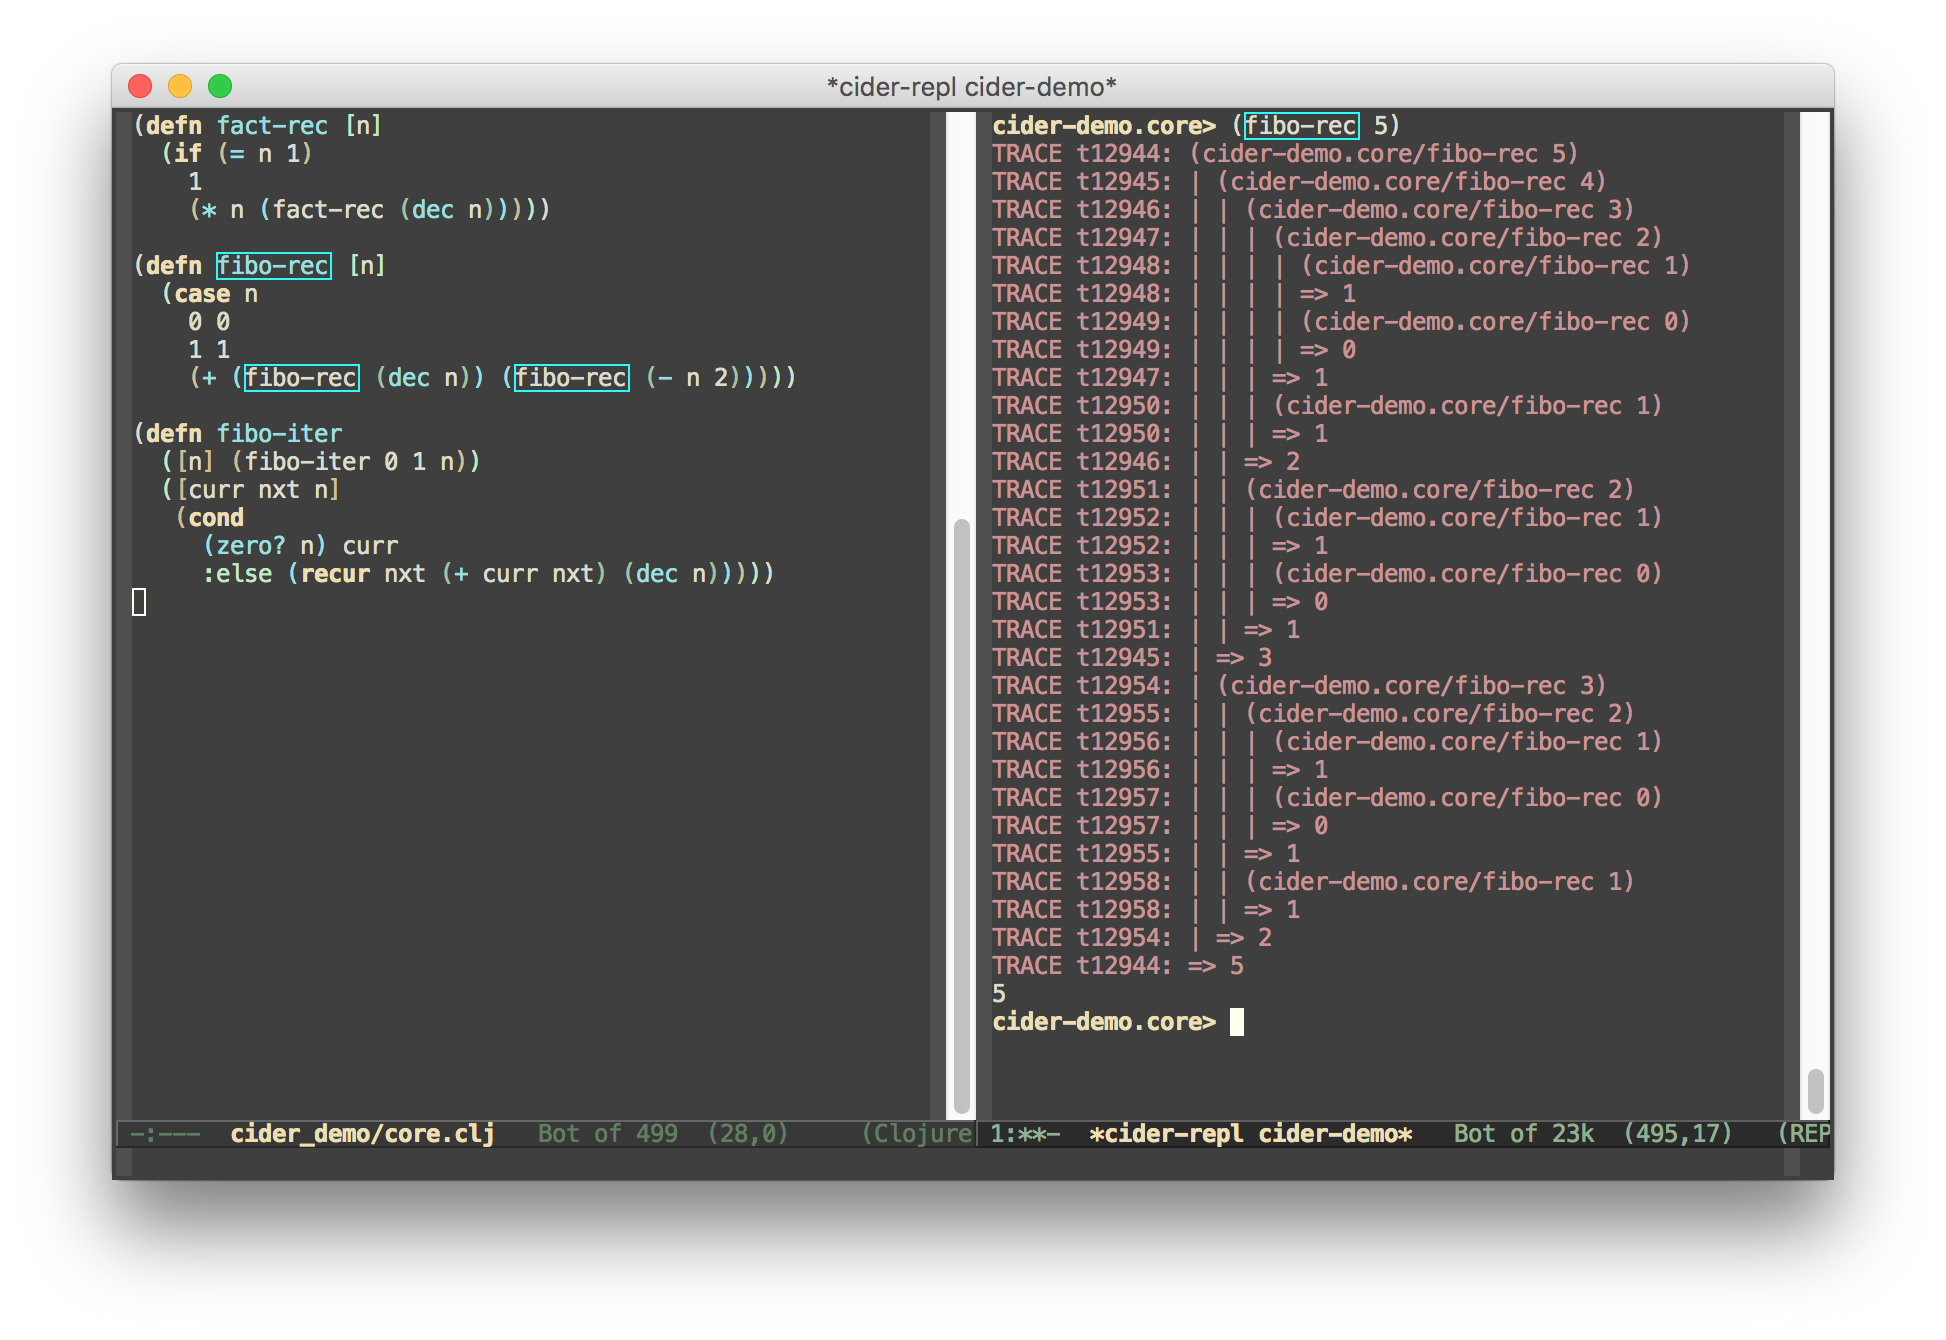
Invoking C-c M-t v again for the same function will result in the function being untraced.
You can also use C-c M-t n to toggle tracing on and off for an entire namespace.
Since it’s easy to lose track of what you’ve traced, cider-list-traced
displays all the currently traced vars and namespaces in a buffer, and
cider-untrace-all clears every trace at once.
By default the trace output lands in the REPL, mixed in with everything else.
cider-trace opens a dedicated *cider-trace* buffer instead: trace some
functions, call them, and their calls and return values stream into that buffer
live, indented to show the call nesting. Kill the buffer to stop streaming.
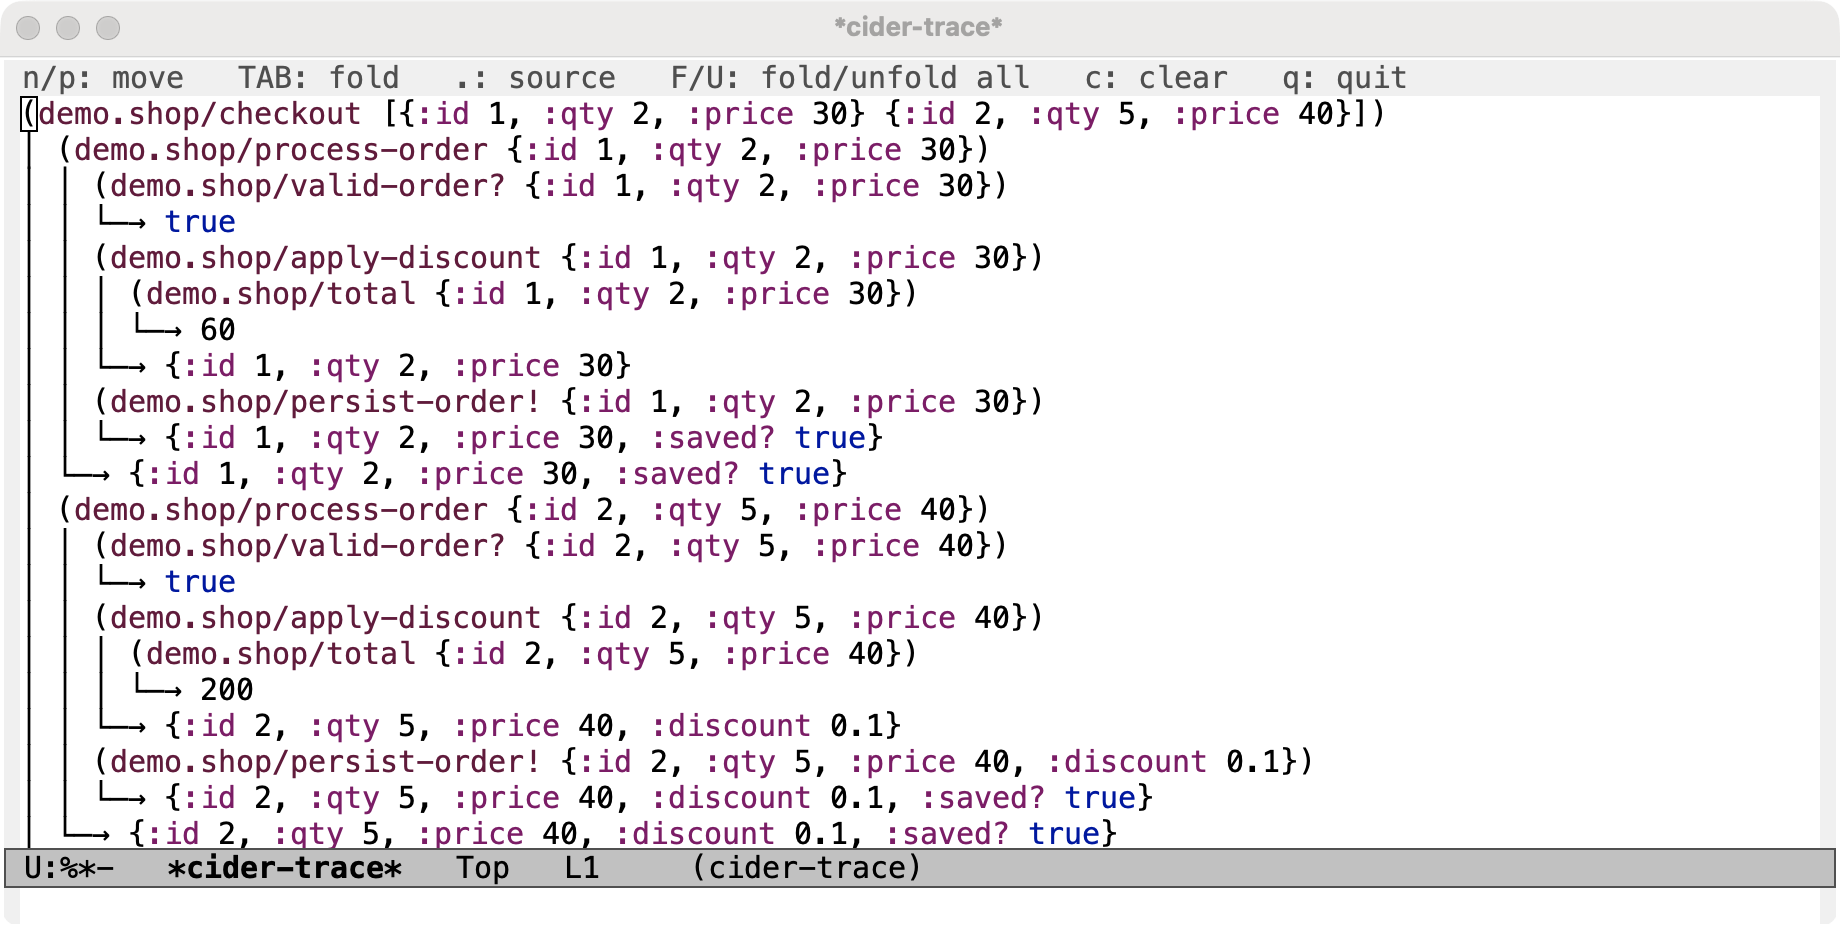
Inside the buffer:
-
TAB (or a click) on a call line folds or unfolds the nested calls between it and its return, so you can collapse the noise and keep just the call and its result; F and U fold and unfold everything at once.
-
n and p move between calls.
-
. (or clicking a function’s name) jumps to its definition.
The same actions are available from the CIDER Trace menu.
All of these require a recent enough cider-nrepl.